Posted by on
Following our previous post about the ELK stack and the Bro IDS, we present in this post how to use this setup to monitor your DNS traffic and detect DNS tunneling.
For our showcase here, the requirements are the following:
- Bro installed and seeing all your DNS traffic: we can use Brostash to deploy a Bro based sensor.
- ELK installed and configured to ingest the logs generated by Bro: see the previous blog post on to build a data-pipeline to manage these data.
In the literature, we find many methods to detect DNS tunneling (see this SANS paper). One of the effective methods is based on the passive analysis of DNS queries. In particular, analyzing the length of the FQDN (Fully Qualified Domain Name) and/or the count of FQDN per second level domains. We take here the Bro DNS logs and ingest them in Elasticsearch using a data-pipeline built with Logstash. As shown in the previous blog post, we parse the Bro DNS logs and enrich them with meta data about the length of the FQDN and the corresponding second level domain associated with this FQDN (e.g. example.com for the FQDN essc-01.server.example.com).
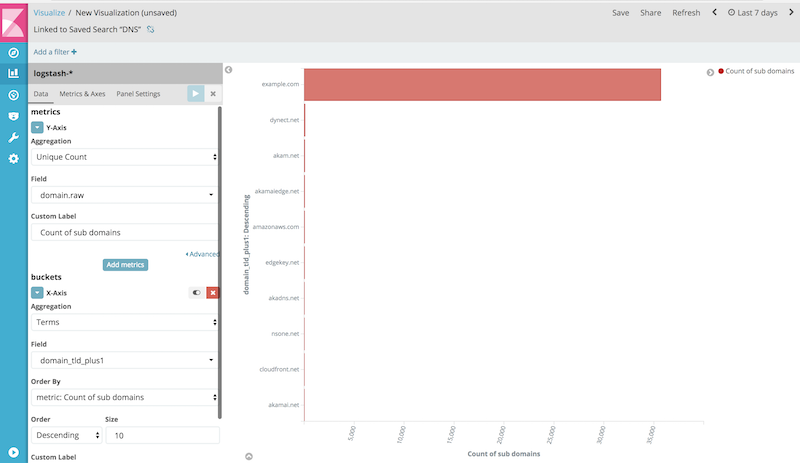
With this setup, detecting DNS tunneling becomes just running Elasticsearch queries using the aggregation feature. We can use Kibana to build visualization highlighting this as show in the following screenshot.

The visualization above shows that the domain example.com is showing a highly unusual number of sub domains. With this Kibana visualization, this kind of anomaly can easily be spotted. We are using here the dnscat2 DNS tunneling server and client. Details about how to setup this DNS tunneling solution can be found in this blog post.
Another option is to use Elasticsearch REST API to run the aggregation query and collect the data as JSON object. This data can then be used as the input of another data wrangling process.
{
  "size": 0,
  "aggs": {
    "2": {
      "terms": {
        "field": "domain_tld_plus1",
        "size": 10,
        "order": {
          "1": "desc"
        }
      },
      "aggs": {
        "1": {
          "cardinality": {
            "field": "domain.raw"
          }
        }
      }
    }
  },
...
}
With the above Elasticsearch query JSON, we will get the top 10 second level domains by sub domains (FQDN) count. We can then automatically filter out the results using some white listing feed (e.g. Cisco Umbrella Top 1 million) or our own historical passive DNS historical data.